|
The image below shows six graphs, each have different relationships between time and the height of the flag. Graph (a) shows that in the time that it took to raise the flag, the flag was raised consistently. Graph (b) shows that in a short amount of time the flag was raised rather high and then the time to raise the flag slowed down. In graph (c) the flag is hoisted up a little bit and then there is some time that passes before the flag is hoisted again and the pattern continues until the flag reaches the top. Graph (d) shows that at first hoisting the graph is slow-going and then it speeds up at the end. Graph (e) shows that in the middle of the process the flag is hoisted at a large height in a short amount of time and then slows down until it reaches its maximum height. The last graph shows that at a certain time the flag was instantly at the top of the flag post. I would say that the most realistic of these graphs would be graph (c). To raise a flag you have to grab some rope and pull it towards yourself, grab some more rope and pull it some more. There is a pause when you go to grab more rope and the pause is represented in graph (c). Obviously, graph (f) in the least realistic of the graphs below. It shows that the flag is instantly hoisted to the top of the flag pole which is pretty impossible. 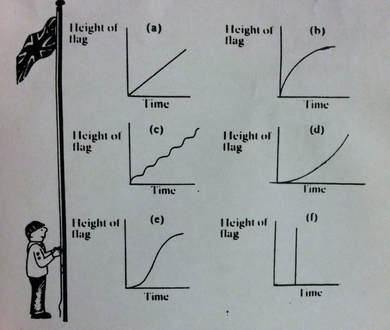
0 Comments
Leave a Reply. |
AuthorWrite something about yourself. No need to be fancy, just an overview. Archives
November 2017
Categories |
 RSS Feed
